Warm Homes Local Grant statistics: what has been fitted
Updated 28 September 2026 · SEO Dons Editorial
The Department for Energy Security and Net Zero publishes official statistics on the Warm Homes: Local Grant. The August 2026 release, published on 27 August 2026, covers activity from the start of the scheme to the end of July 2026. It is the most recent release at the time of writing: DESNZ has moved the series from monthly to quarterly publication, and the next release is due on 26 November 2026.
The headline numbers
| Measure of activity | To end of July 2026 |
|---|---|
| Measures reported by grant recipients | about 11,250 |
| Households with measures reported | about 5,470 |
| Grant recipients reporting | 67 of 74 |
| Measures lodged in the TrustMark data warehouse | about 14,700 |
| Households with TrustMark lodgements | about 6,700 |
Two sets of figures appear because they come from two places. Grant recipient reports are what councils tell DESNZ about their own projects. TrustMark lodgements are the records installers and retrofit coordinators lodge for every measure, which is a condition of funding. The TrustMark numbers are higher, which fits DESNZ’s warning that the figures under-report actual activity, especially in the most recent months.
For comparison, the July 2026 release (published 30 July 2026, covering the scheme to the end of June 2026) reported about 10,460 measures in about 5,100 households from 68 grant recipients. The totals grow release by release as late returns arrive.
What is being fitted
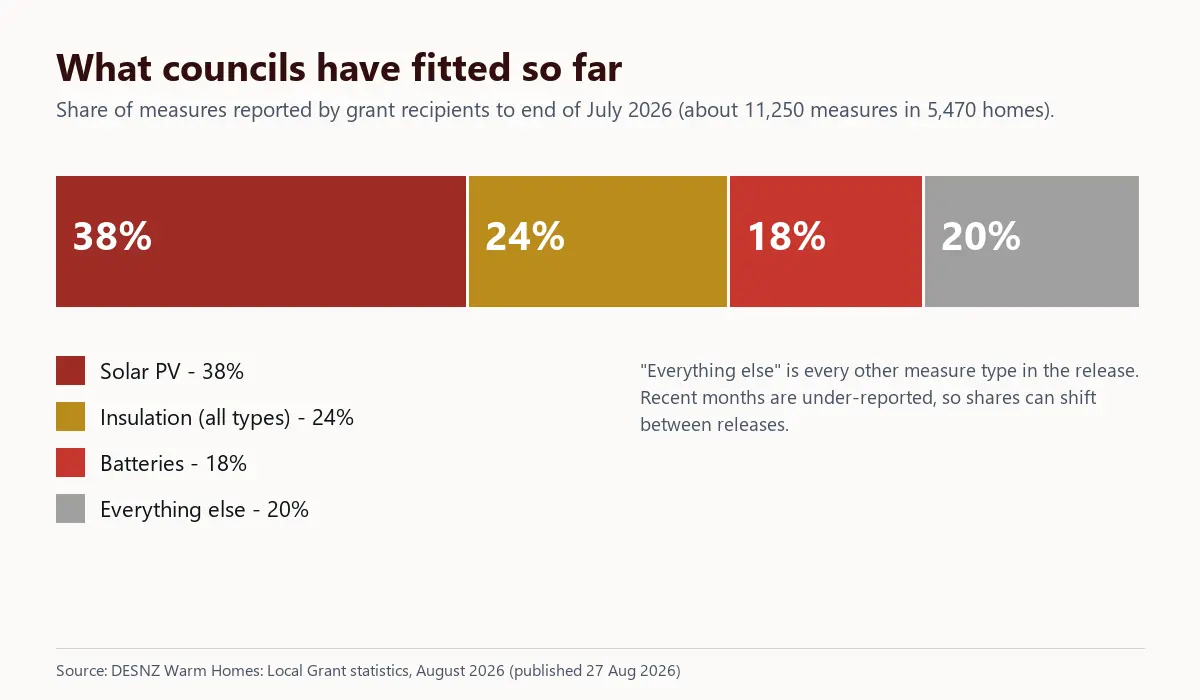
The August 2026 release breaks down measures reported by grant recipients:
- Solar PV: 38%, the most common single measure
- Insulation of all kinds: about 24%
- Batteries: 18%, which under the rules can only be fitted alongside solar PV
- Everything else: the remaining fifth, covering other measure types
The dominance of solar reflects the scheme’s design. The policy guidance tells councils and retrofit coordinators to choose the package with the largest bill saving for the money, and it explicitly names “smart packages such as Solar PV, smart controls, and/or domestic batteries” as a way to achieve higher savings for a lower price in some homes. Batteries were paused in November 2025 and restarted on 2 February 2026, so their share may shift as that restart feeds through the figures.
Where the upgraded homes are
| Region | Share of upgraded homes |
|---|---|
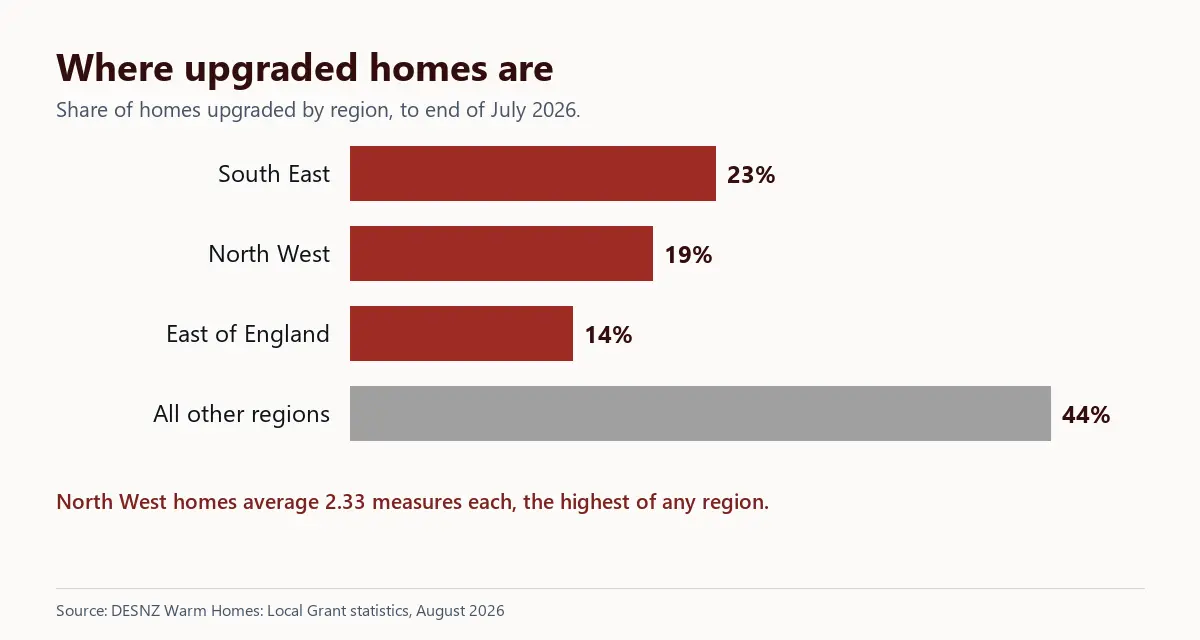
| South East | 23% |
| North West | 19% |
| East of England | 14% |
| All other regions | the remaining 44% |
North West homes had the most measures each, averaging 2.33 per household. Regional shares depend on how quickly each council’s project mobilised as much as on need, so they say more about delivery speed than about where eligible households live.
How the numbers compare with the budget
The Warm Homes: Local Grant has £500 million for delivery between April 2025 and March 2028, allocated to 74 council projects involving 271 local authorities. Delivery was always expected to start slowly: councils had to procure contractors and pass a delivery assurance check before drawing down money, and the batch system releases funding as homes become ready to retrofit. The statistics are best read as a trend, release by release, rather than as a verdict on the scheme at any single point.
The predecessor schemes give a sense of scale. By the end of June 2025, the Local Authority Delivery scheme (phases 1 to 3) and the Home Upgrade Grant (phases 1 and 2) together had reported 106,000 measures in 74,400 households.
What the statistics do not tell you
- Whether your council has capacity. The figures are national and regional. They say nothing about waiting lists in a particular area. Use the council lookup and ask your council directly.
- How much each home received. The release counts measures and households, not spend per home. The cost caps (£16,600 energy performance and £16,600 low carbon heating per home) are project averages.
- Tenure or fuel type. The August 2026 release does not break down homes by owner occupier and private rented, or by heating fuel.
What the figures mean for an applicant
For a household thinking about applying, the useful reading is simple. Councils are delivering, the most common packages involve solar panels, insulation and batteries, and the pace varies by region. None of that changes whether you qualify: that still depends on the three income pathways and the property rules. It may, though, shape what the retrofit coordinator proposes for your home, and how long your council’s queue is.
If you are not eligible, or stuck in a queue: installing energy-saving materials in a home is zero-rated for VAT until 31 March 2027, then 5% (VAT Notice 708/6). The Boiler Upgrade Scheme gives £7,500 towards a heat pump with no income test, or £9,000 replacing oil or LPG off the gas grid until 31 March 2027. Other routes.
Reading future releases
The next release is due on 26 November 2026. When it lands, the useful questions are: has the measure count grown in line with the months elapsed, has the battery share recovered after the restart, and has the gap between council reports and TrustMark lodgements narrowed? We will update this page when it is published.
If you are wondering whether you could be one of the next households, start with who qualifies and the postcode checker.
Sources: DESNZ, Warm Homes: Local Grant statistics, August 2026 and July 2026; DESNZ policy guidance (June 2026); Green Homes Grant LAD and HUG statistics, August 2025. All read 28 September 2026.